Have you ever faced memory issues in your Java applications? Whether it's an OutOfMemoryError or performance degradation, understanding the JVM's memory management is crucial for effective troubleshooting. In this post, we'll explore the basic JVM memory architecture, common issues, and tools to diagnose and resolve memory-related problems.
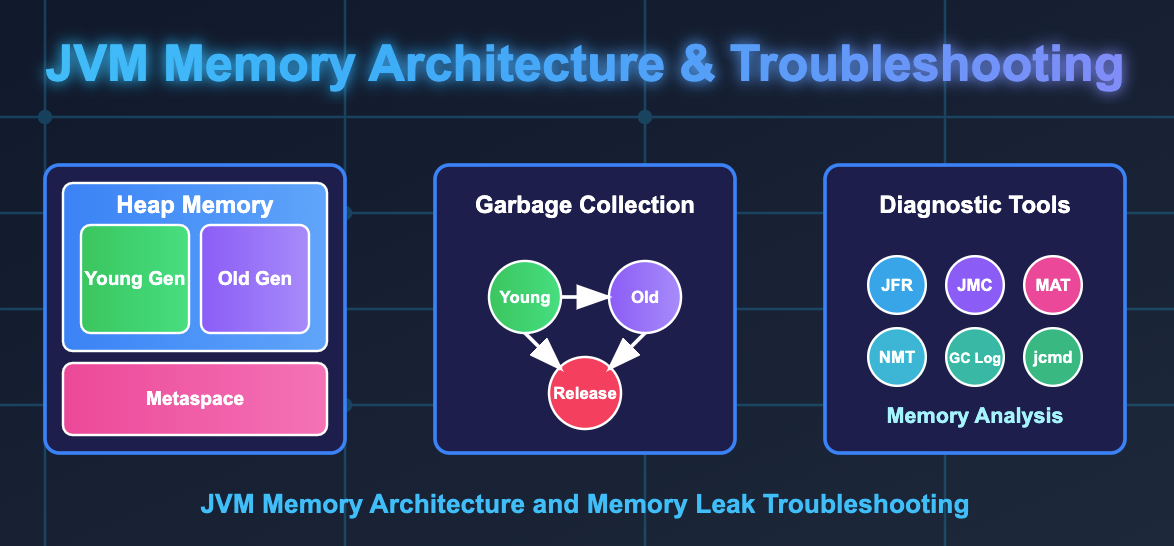
Below are the key components of the JVM memory architecture:
Memory that gets used by the Java process is the sum of the memory used for all the above components. When I started working with Java, I used to think that the heap is the only memory area and used to wonder why the memory usage of the Java process is always more than the heap size. Heap is just one of the components of the Java process memory.
Garbage Collection (GC) is a process of automatic memory management in Java. It helps reclaim memory by removing objects that are no longer in use. The JVM uses different GC algorithms to manage memory efficiently, such as Serial, Parallel, CMS, G1, and ZGC. Each algorithm has its own strengths and weaknesses, and the choice of GC can significantly impact application performance.
Heap is divided into two main areas:
The diagram above illustrates how objects move through different memory areas in the JVM during their lifecycle:
New objects are allocated in Eden space
When Eden fills up, a minor GC is triggered
Live objects from Eden move to one of the survivor spaces (S0)
At the next minor GC, live objects from Eden and S0 move to S1; S0 is cleared
Survivor spaces alternate roles in each minor GC cycle
Objects that survive multiple GC cycles are promoted to the Old Generation
This generational garbage collection approach is based on the empirical observation that most objects die young. By separating short-lived and long-lived objects, the JVM can optimize garbage collection and improve overall application performance.
Each thread has its own stack that contains:
All objects are created in the shared heap:
Memory management implications:
Now that we have a basic understanding of JVM memory sections, let's look at some common issues that can arise in these areas and how to troubleshoot them.
Below are some common troubleshooting steps for Java heap memory issues:
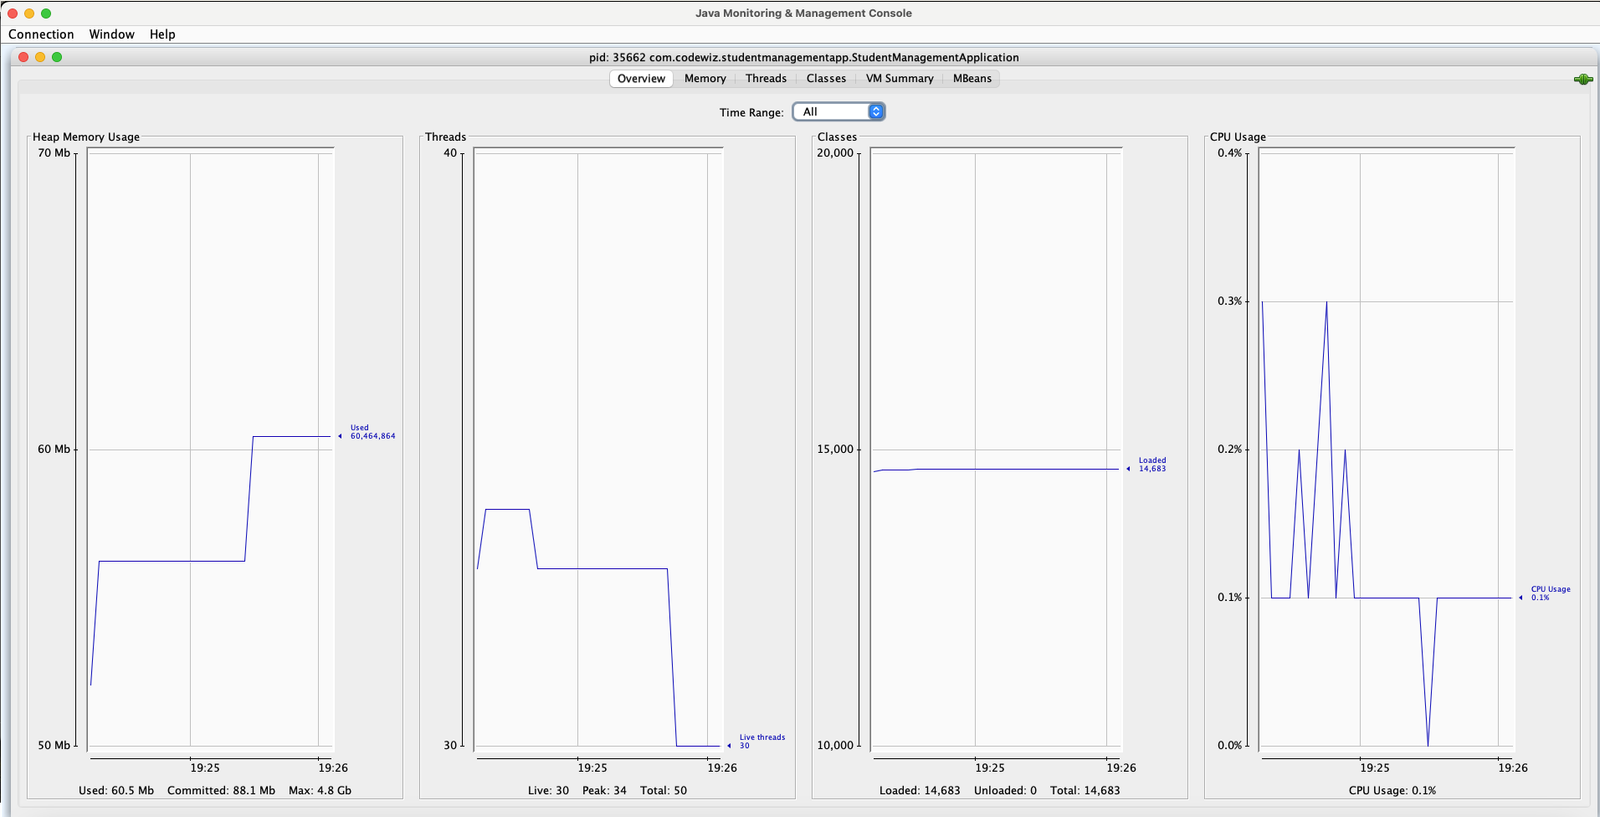
-Xms, -Xmx). For example, -Xms512m -Xmx2g.JConsole is a tool included as part of JDK and can be used to monitor heap usage, thread activity, and other JVM metrics. It provides a graphical interface for monitoring and managing Java applications. You can start it by running jconsole in JDK bin directory. After that you can connect to the JVM you want to monitor.
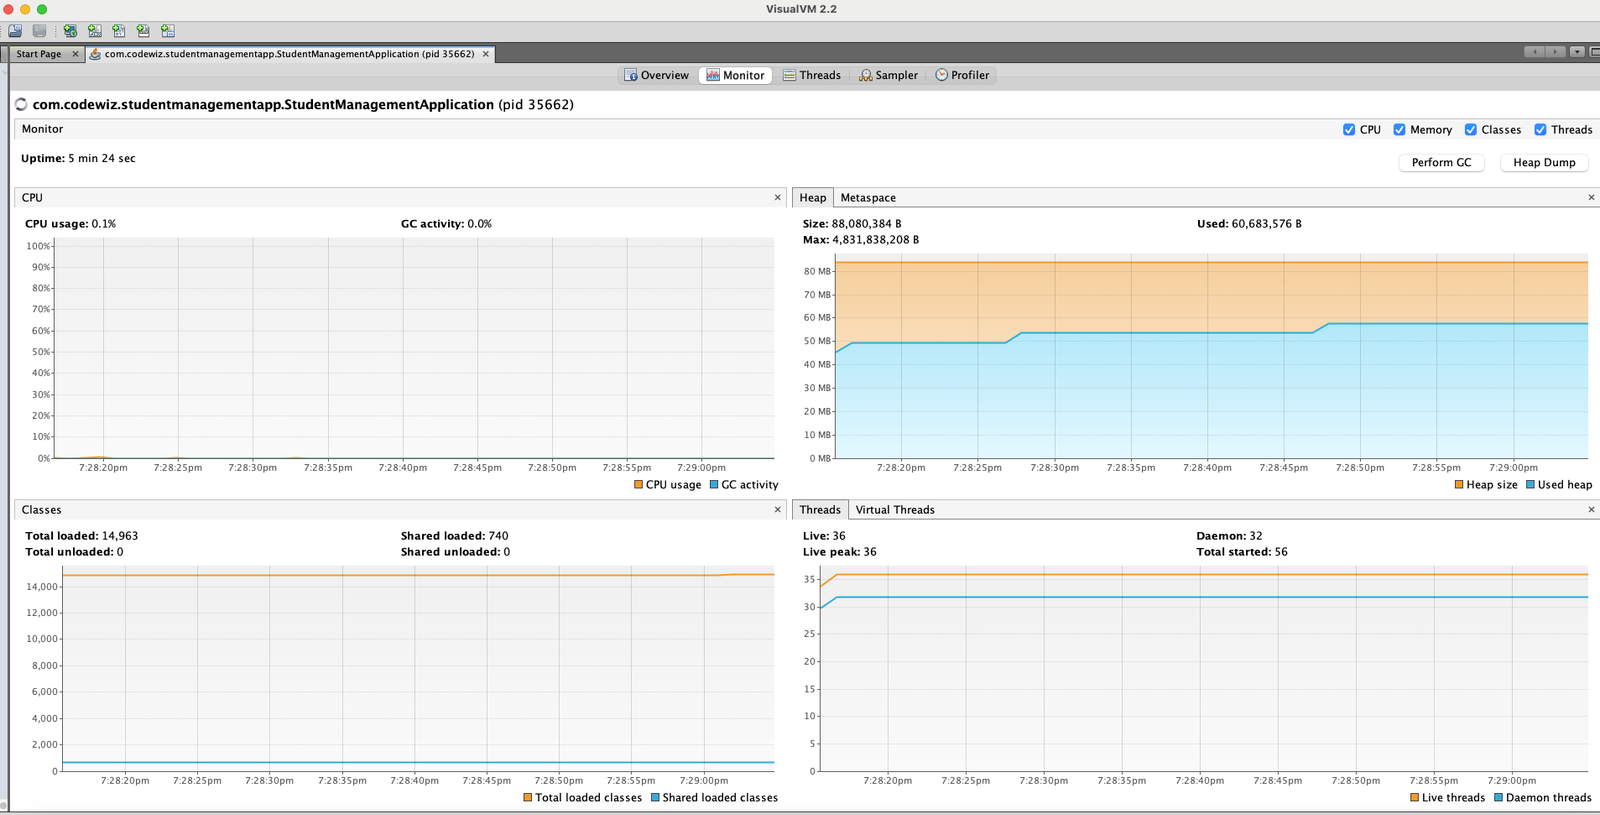
JVisual VM is another tool that provides a graphical interface for monitoring and profiling Java applications. It allows you to visualize memory usage, CPU usage, and thread activity in real-time. You can download it from https://visualvm.github.io/download
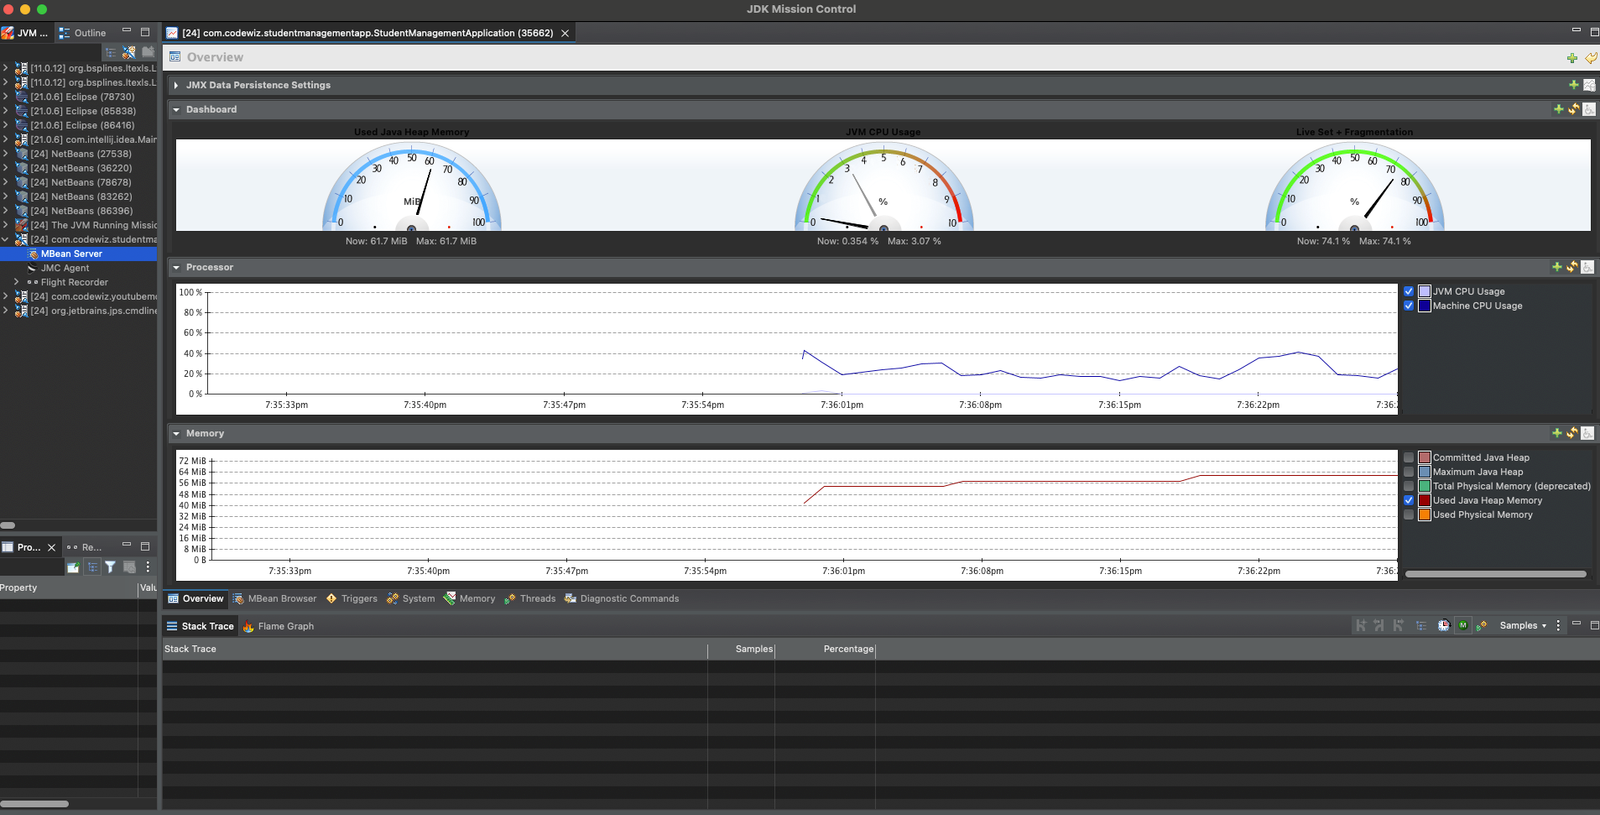
Java Mission Control (JMC) is a powerful monitoring and profiling suite which works seamlessly with Java Flight Recorder (JFR) to create a comprehensive toolchain for analyzing Java application performance. JFR collects detailed low-level runtime data from the JVM with minimal overhead, while JMC provides an intuitive interface to analyze this data. Together, they enable developers to diagnose performance issues, memory leaks, and other runtime problems in both development and production environments. You can download JMC from Oracle's website.
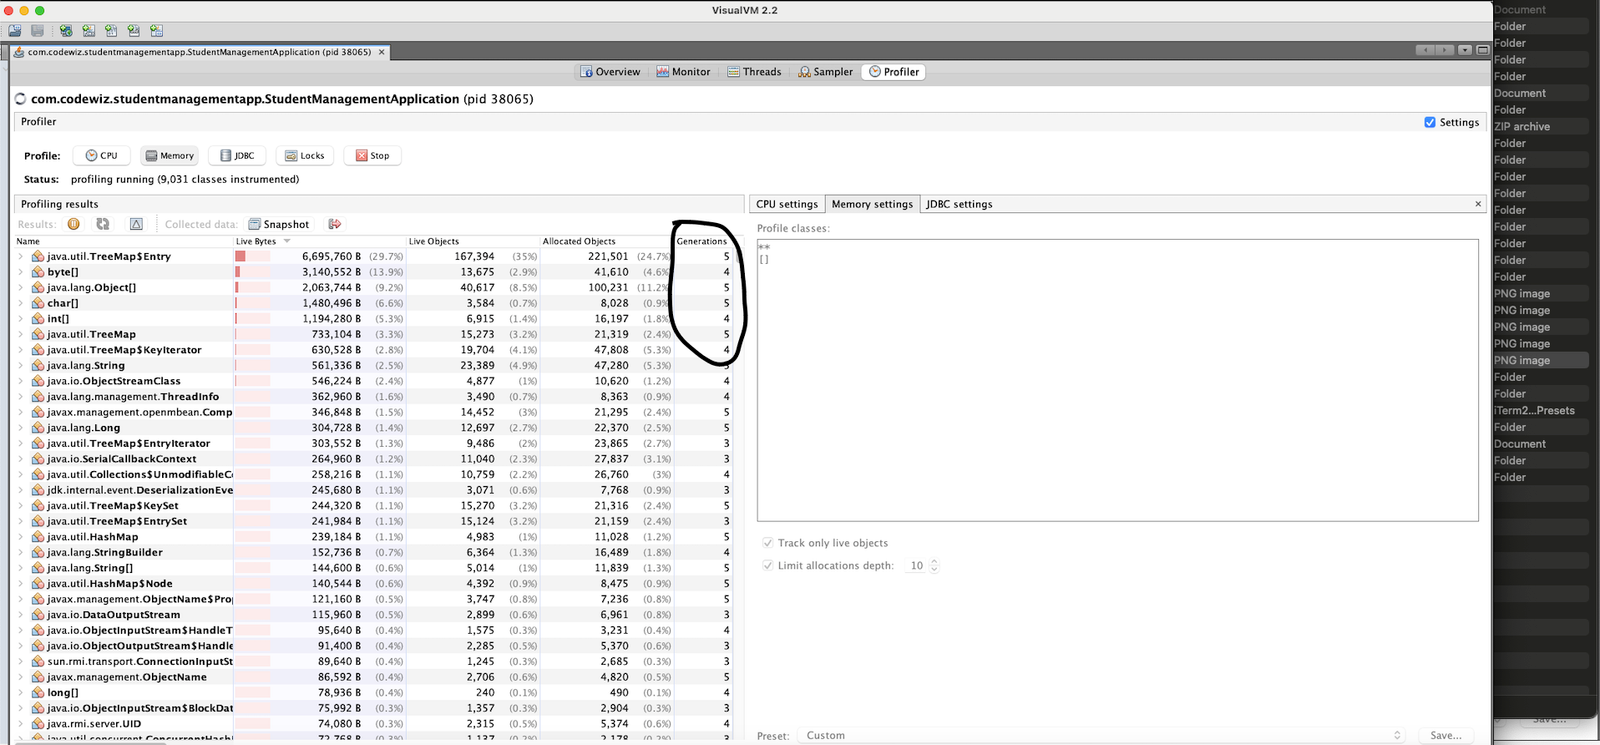
You can use profiling tools like Visual VM to identify potential memory leaks. Generational count shown in the below profiling screenshot can help us identify the objects not getting garbage collected. Generational count is the number of times an object has survived a garbage collection cycle. If the generational count is high, it indicates that the object is long-lived and may be a candidate for memory leaks.
All these 3 tools connect to JVM via JMX (Java Management Extensions). All this profiling data is available via JMX.
-XX:MaxMetaspaceSize).JConsole, JVisual VM, and JDK Mission Control can be used to monitor metaspace usage.
jcmd, jmap, or Native Memory Tracking (NMT).-XX:NativeMemoryTracking=summary|detail to track native memory usage.| Data Type | Tool/Source | Use Case |
|---|---|---|
| GC Logs | JVM options (-Xlog:gc*) | Analyze GC frequency, pause times, trends |
| Heap Dumps | jcmd, jmap, JMC | Analyze object retention, leaks |
| Heap Histograms | jcmd, jmap | Quick view of object counts/sizes |
| Java Flight Recorder | JFR, JMC | Profile allocations, memory leaks |
| Native Memory Tracking | NMT (-XX:NativeMemoryTracking=summary) | Track JVM native allocations |
| OS Tools | ps,top, pmap, perfmon | Monitor total process/native memory |
| Core Files | OS, gdb | Deep native memory analysis |
Will provide insights into:
-Xlog:gc* (JDK 9+) or -XX:+PrintGCDetails (JDK 8) to collect logs.Sample logs below:
[8.257s][info][gc,start       ] GC(26) Pause Young (Mixed) (G1 Evacuation Pause)
[8.257s][info][gc,task        ] GC(26) Using 8 workers of 9 for evacuation
[8.264s][info][gc,phases      ] GC(26)   Pre Evacuate Collection Set: 0.09ms
[8.264s][info][gc,phases      ] GC(26)   Merge Heap Roots: 0.07ms
[8.264s][info][gc,phases      ] GC(26)   Evacuate Collection Set: 6.99ms
[8.264s][info][gc,phases      ] GC(26)   Post Evacuate Collection Set: 0.21ms
[8.264s][info][gc,phases      ] GC(26)   Other: 0.05ms
[8.264s][info][gc,heap        ] GC(26) Eden regions: 16->0(12)
[8.264s][info][gc,heap        ] GC(26) Survivor regions: 4->3(3)
[8.264s][info][gc,heap        ] GC(26) Old regions: 39->49
[8.264s][info][gc,heap        ] GC(26) Humongous regions: 0->0
[8.264s][info][gc,metaspace   ] GC(26) Metaspace: 75330K(75840K)->75330K(75840K) NonClass: 67338K(67648K)->67338K(67648K) Class: 7992K(8192K)->7992K(8192K)
[8.264s][info][gc             ] GC(26) Pause Young (Mixed) (G1 Evacuation Pause) 230M->204M(348M) 7.487ms
[8.264s][info][gc,cpu         ] GC(26) User=0.05s Sys=0.01s Real=0.00s
We can also use Visualization tools (JMC, GCViewer, GCEasy) which will help spot trends and issues quickly.
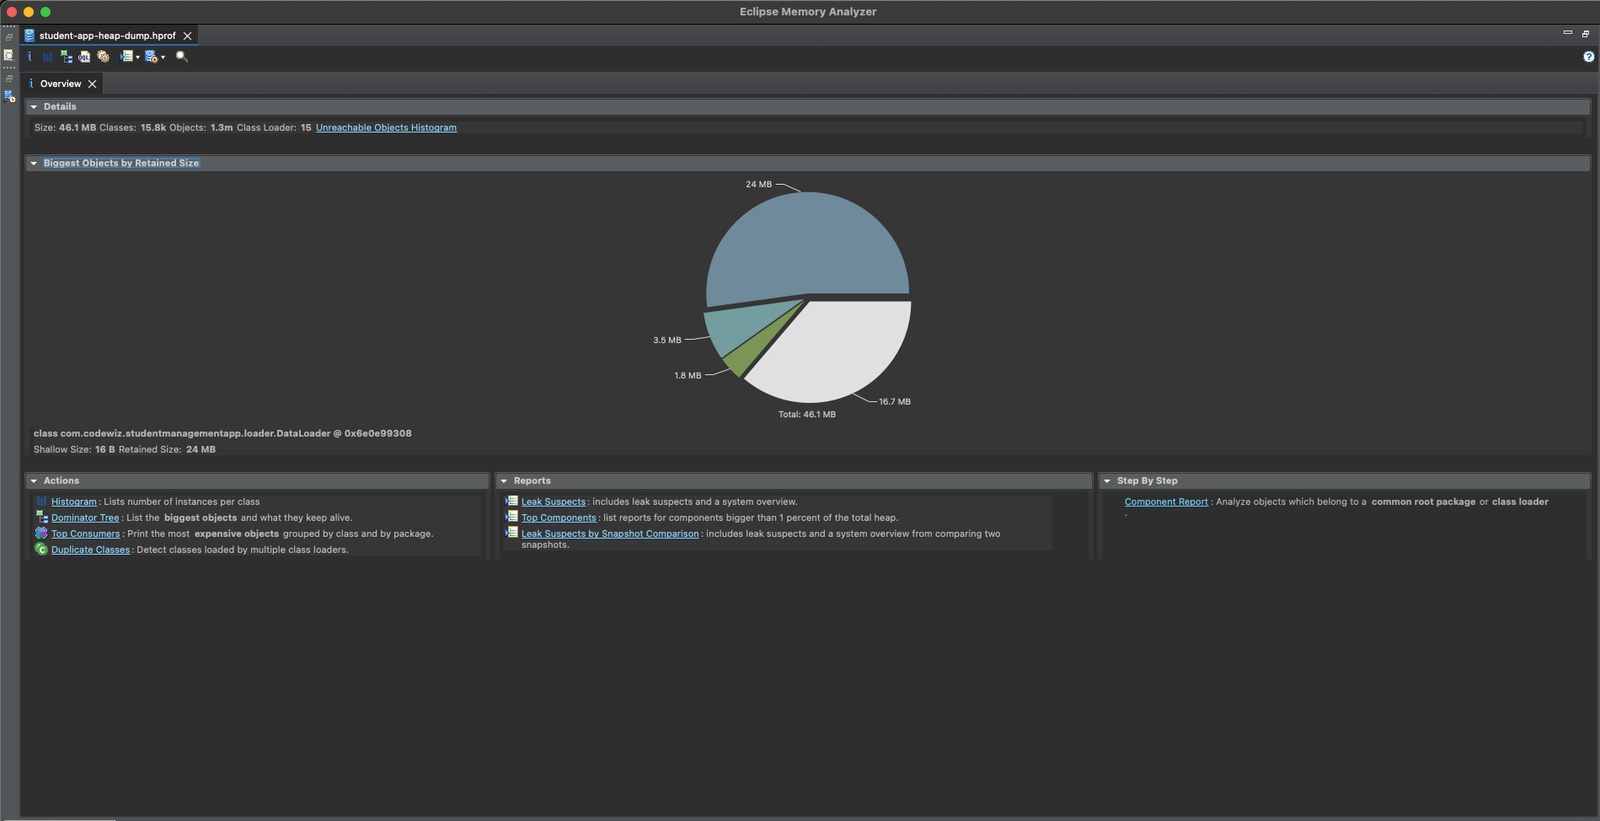
jmap or jcmd.-XX:+HeapDumpOnOutOfMemoryError to get a heap dump when OOM occurs.jmap -dump:format=b,file=<filename>.hprof <java process id> For example: jmap -dump:format=b,file=student-app-heap-dump.hprof 38065 Dumping heap to /Users/codewiz/student-management-app/studentmanagement-api/student-app-heap-dump.hprof ... Heap dump file created [172972444 bytes in 0.577 secs]
Now we can use Eclipse MAT to analyze the heap dump file.
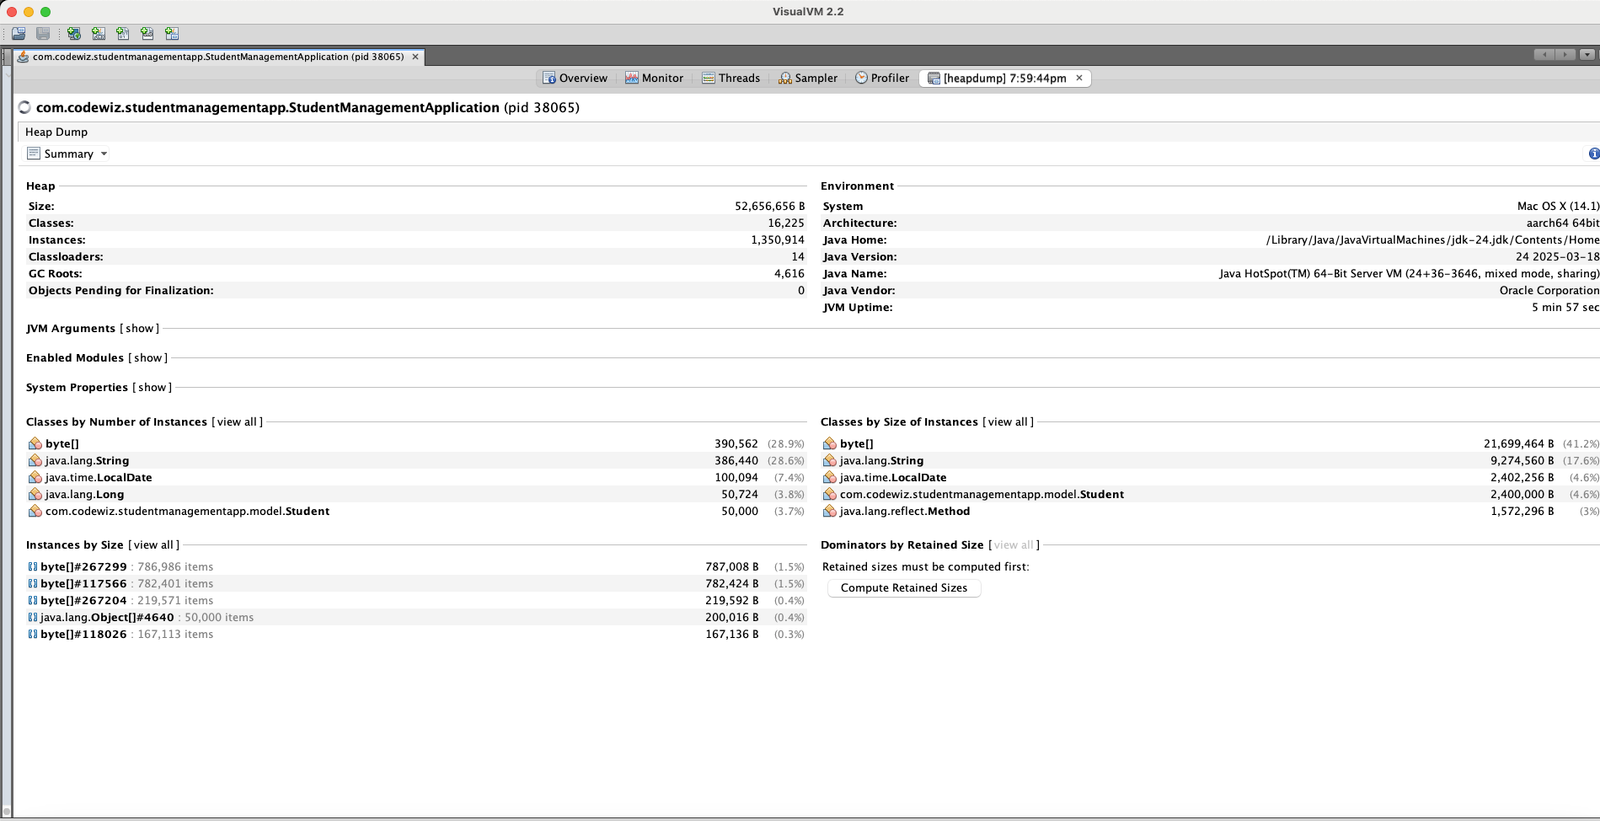
You can also see the same information in Visual VM.
Java Flight Recorder (JFR) is a tool for collecting diagnostic and profiling data built into the JVM. It collects low-level runtime data with minimal overhead.
-XX:StartFlightRecording or use jcmd to start recording on a running process.Native Memory Tracking (NMT) is a built-in tool in the JVM that tracks native allocations made by the JVM.
Enable NMT when starting your Java application by adding one of these options:
# For summary-level tracking
java -XX:NativeMemoryTracking=summary -jar your-application.jar

# For detailed tracking (higher overhead)
java -XX:NativeMemoryTracking=detail -jar your-application.jar
Also you can enable NMT in a running JVM using jcmd
Create a baseline early in your application's lifecycle:
jcmd <pid> VM.native_memory baseline
This captures the initial memory state for comparison.
Monitor changes over time by comparing against the baseline:
jcmd <pid> VM.native_memory detail.diff
Run this command periodically to observe memory growth patterns.
Analyze the results - Look for consistently growing memory categories across multiple measurements. Native memory leaks often appear as gradual growth that never decreases.
ps, top, pmap (Linux/macOS), or perfmon, VMMap (Windows) to monitor process memory.gdb to inspect native allocations and leaks.To stay updated with the latest in Java, Spring, and modern software development, follow me for in-depth tutorials and updates:
Explore the top 5 features released from Java 21 to Java 23, including Virtual Threads, Pattern Matching with Records and Sealed Classes, Structured Concurrency, Scoped Values, and Stream Gatherers. Learn how these features can enhance your Java applications.
Explore the most significant changes in JDK 24. Learn about language enhancements, performance improvements, new APIs, and security upgrades with practical code examples.
Find the most popular YouTube creators in tech categories like AI, Java, JavaScript, Python, .NET, and developer conferences. Perfect for learning, inspiration, and staying updated with the best tech content.
Get instant AI-powered summaries of YouTube videos and websites. Save time while enhancing your learning experience.
